1. Academic Achievement:
1.0 Using clearly defined, research-based instructional practices, curricula, interventions, and enrichment experiences, CUSD learners will perform in the top 10% of San Diego County students as measured by a variety of metrics and assessments.
On an annual basis, CUSD administers multiple assessments to measure student achievement. The results of these assessments are critical in defining and prioritizing actions and decisions related to curriculum, instruction, interventions and enrichment experiences. This report will provide an overview of multiple student achievement measures (CAASPP, SAT, ACT, AP and School Dashboard Indicators) through the lens of county comparisons, in order to determine our performance as it relates to our goal to be in the top 10% of San Diego County school districts.
CAASPP: The following chart provides CAASPP scores (annual spring assessment) in English Language Arts (ELA) and Mathematics for all San Diego County School Districts over the last three years; indicating the percentage of students performing at or above standard in the specified subject area. The chart is purposefully organized into three sections; showing comparisons amongst similar districts: elementary school districts, union high school districts and unified school districts. Please note the distinct differences between these three sections when comparing percentages; as not all school districts test the same grade levels, thus skewing comparisons. Elementary school districts are grades K-6 and grades K-8 districts. Union high school districts are grades 7-12 and grades 9-12 districts. Unified school districts are grades K-12 districts.
|
School District
|
Grade
|
ELA
|
Math
|
|
Level
|
2017
|
2018
|
2019
|
2017
|
2018
|
2019
|
|
Alpine Union Elementary
|
K-8
|
55.25%
|
58.49%
|
56.01%
|
41.73%
|
40.06%
|
40.84%
|
|
Cajon Valley Union
|
K-8
|
41.66%
|
41.75%
|
41.44%
|
32.45%
|
32.37%
|
32.56%
|
|
Cardiff Elementary
|
K-6
|
72.35%
|
74.61%
|
72.28%
|
72.59%
|
71.76%
|
73.58%
|
|
Chula Vista Elementary
|
K-6
|
62.55%
|
64.39%
|
63.90%
|
50.78%
|
51.68%
|
52.49%
|
|
Dehesa Elementary
|
K-8
|
35.24%
|
28.42%
|
31.52%
|
32.38%
|
36.84%
|
31.52%
|
|
Del Mar Union Elementary
|
K-6
|
86.30%
|
86.24%
|
86.15%
|
84.74%
|
83.97%
|
84.30%
|
|
Encinitas Union Elementary
|
K-6
|
75.93%
|
74.70%
|
74.68%
|
73.19%
|
70.79%
|
70.68%
|
|
Escondido Union
|
K-8
|
39.26%
|
41.80%
|
41.71%
|
26.62%
|
29.54%
|
30.16%
|
|
Fallbrook Union Elementary
|
K-8
|
56.77%
|
56.54%
|
53.33%
|
44.60%
|
45.02%
|
43.41%
|
|
Jamul-Dulzura Union Elementary
|
K-8
|
51.40%
|
47.18%
|
47.06%
|
36.11%
|
36.67%
|
34.48%
|
|
Julian Union Elementary
|
K-8
|
41.09%
|
38.14%
|
39.39%
|
44.61%
|
32.14%
|
35.35%
|
|
La Mesa-Spring Valley
|
K-8
|
50.65%
|
53.35%
|
52.87%
|
38.83%
|
40.10%
|
41.74%
|
|
Lakeside Union Elementary
|
K-8
|
51.53%
|
53.47%
|
52.46%
|
39.36%
|
41.62%
|
41.39%
|
|
Lemon Grove
|
K-8
|
40.29%
|
46.02%
|
46.20%
|
33.18%
|
35.69%
|
34.61%
|
|
National Elementary
|
K-6
|
41.58%
|
43.07%
|
42.49%
|
31.05%
|
32.95%
|
32.03%
|
|
Rancho Santa Fe Elementary
|
K-8
|
86.96%
|
85.00%
|
89.93%
|
82.88%
|
81.56%
|
83.37%
|
|
San Pasqual Union Elementary
|
K-8
|
64.52%
|
56.33%
|
64.69%
|
52.82%
|
50.39%
|
55.18%
|
|
San Ysidro Elementary
|
K-8
|
37.28%
|
39.68%
|
40.55%
|
27.10%
|
28.78%
|
31.45%
|
|
Santee
|
K-8
|
54.52%
|
56.55%
|
55.68%
|
47.44%
|
49.10%
|
48.84%
|
|
Solana Beach Elementary
|
K-6
|
85.44%
|
85.41%
|
85.31%
|
79.98%
|
81.03%
|
82.32%
|
|
South Bay Union
|
K-8
|
35.66%
|
36.45%
|
35.60%
|
28.78%
|
28.58%
|
30.09%
|
|
Spencer Valley Elementary
|
K-8
|
83.33%
|
65.00%
|
73.68%
|
83.33%
|
60.00%
|
89.47%
|
|
Vallecitos Elementary
|
K-8
|
59.68%
|
58.57%
|
54.26%
|
43.55%
|
38.03%
|
39.23%
|
|
Escondido Union High
|
9-12
|
57.01%
|
56.87%
|
57.58%
|
25.68%
|
23.10%
|
20.82%
|
|
Fallbrook Union High
|
9-12
|
48.02%
|
51.54%
|
49.31%
|
22.97%
|
24.02%
|
21.39%
|
|
Grossmont Union High
|
9-12
|
64.99%
|
60.10%
|
56.07%
|
36.68%
|
33.67%
|
32.72%
|
|
Julian Union High
|
9-12
|
57.14%
|
70.83%
|
65.00%
|
14.29%
|
39.13%
|
25.00%
|
|
San Dieguito Union High
|
7-12
|
81.11%
|
80.33%
|
79.55%
|
71.70%
|
72.17%
|
72.11%
|
|
Sweetwater Union High
|
7-12
|
54.10%
|
52.79%
|
54.43%
|
31.75%
|
32.49%
|
32.71%
|
|
Bonsall Unified
|
K-12
|
63.16%
|
62.77%
|
63.09%
|
60.40%
|
54.47%
|
56.12%
|
|
Borrego Springs Unified
|
K-12
|
39.44%
|
41.35%
|
37.24%
|
17.92%
|
25.59%
|
19.90%
|
|
Carlsbad Unified
|
K-12
|
74.88%
|
74.25%
|
75.79%
|
64.72%
|
66.31%
|
67.82%
|
|
Coronado Unified
|
K-12
|
75.76%
|
76.03%
|
78.00%
|
66.26%
|
67.02%
|
67.60%
|
|
Mountain Empire Unified
|
K-12
|
34.53%
|
38.31%
|
37.40%
|
20.28%
|
21.05%
|
24.42%
|
|
Oceanside Unified
|
K-12
|
41.78%
|
44.24%
|
45.55%
|
35.38%
|
35.32%
|
36.23%
|
|
Poway Unified
|
K-12
|
74.10%
|
74.29%
|
75.81%
|
66.46%
|
67.32%
|
70.03%
|
|
Ramona City Unified
|
K-12
|
52.45%
|
50.84%
|
52.99%
|
38.39%
|
37.11%
|
37.98%
|
|
San Diego Unified
|
K-12
|
55.59%
|
56.35%
|
56.85%
|
46.03%
|
47.16%
|
48.47%
|
|
San Marcos Unified
|
K-12
|
65.54%
|
64.89%
|
66.76%
|
49.73%
|
51.24%
|
52.61%
|
|
Valley Center-Pauma Unified
|
K-12
|
38.24%
|
40.50%
|
39.35%
|
21.42%
|
22.76%
|
23.96%
|
|
Vista Unified
|
K-12
|
45.83%
|
48.73%
|
49.71%
|
33.42%
|
33.88%
|
37.04%
|
|
Warner Unified
|
K-12
|
17.57%
|
24.36%
|
31.68%
|
13.51%
|
15.38%
|
18.63%
|
As reported above, Coronado Unified School District is the highest ranked unified school district in English Language Arts and tied for the second highest ranked in Mathematics. It is important to note that Poway Unified, the highest ranked in Mathematics, also uses College Preparatory Math (CPM) curricula.
AP/SAT/ACT: The following chart provides AP/SAT/ACT scores (annual assessments) for a cross-section of comparable San Diego County high schools. When interpreting the represented data, it is important to consider differences in the following: enrollment numbers as it relates to staffing and funding, student opportunities within the course offerings (master schedule) and how many courses students can take (bell schedule) and the tests that are available to students. These differences directly impact the displayed averages.

California School Dashboard: The following chart provides the 2019 CA School Dashboard Progress Indicators for all San Diego County School Districts. Like the considerations provided above for interpreting CAASPP and AP/SAT/ACT data, dashboard indicators are also directly impacted by student enrollment, master schedule, bell schedules, student achievement data, student demographics and funding.
https://www6.cde.ca.gov/californiamodel/countydistricts?&year=2019&cdcode=3768031&scode=
District Performance by County for 2019
2. Budget:
Present the Governing Board with a structurally-balanced budget that includes a planned spend-down of reserve funds and minimizes impacts to programs while maximizing student achievement and learning.
2.1 Create a budget plan which demonstrates a reserve spend-down (in anticipation of reaching ‘Basic Aid’ status) ensuring student access to programs, resources, and curricula aligned with CUSD Mission Statement.
As previously shared, in Fall of 2018, the Oversight Board to the Successor Agency ("SA") to the Community Development Agency of the City of Coronado approved a resolution authorizing the refinancing of Redevelopment Agency (RDA) debt. The primary purpose of refunding the outstanding obligations of the SA was to extinguish the outstanding obligations sooner than the date on which extinguishment would occur with the existing interest rate (from 4.97% to approximately 3% through refinancing). The early extinguishment of the debt allows for earlier dissolution of the SA and allows CUSD to reach Community Funded/Basic Aid status nine years earlier than the previous debt repayment schedule from 2036 to 2027. This decision significantly shortened our "Bridge to Basic Aid” and adjusted our reserve spend-down philosophy. Funding as a Community Funded district is anticipated to be significantly higher than under the LCFF which supports CUSD’s plans to spend down its reserves to a reasonable amount, while considering the need for sufficient cash on hand to meet cash flow needs.
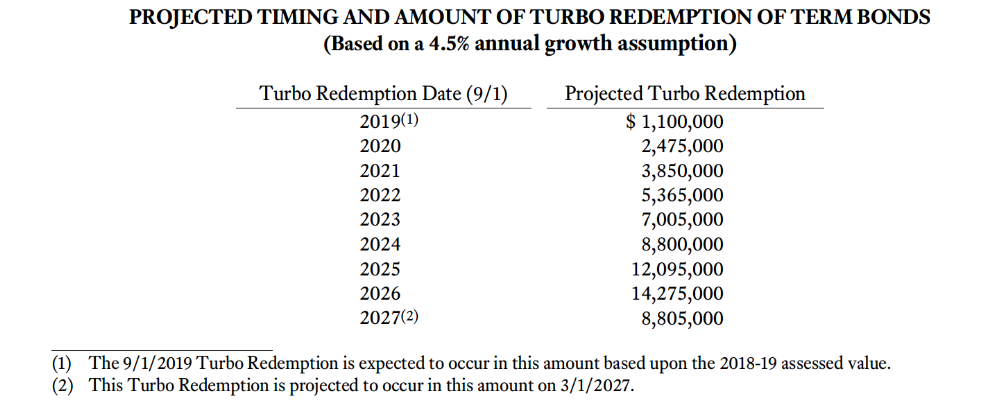
The City of Coronado exceeded the September 1, 2019, projected Turbo Redemption by $300,000 for a contribution of $1.4 million. If this pattern (the ability to increase annual contributions based on actual annual growth) continues, the bond debt will be exhausted at an accelerated date. Working in collaboration with the City of Coronado, we will continue monitoring annual Turbo Redemption payments and make adjustments to our budget plan as appropriate.
4.0 Communication:
4.3 One School, One Campus Update
In March, 2019, the Governing Board approved the relocation of Transitional Kindergarten and Kindergarten students back to the main campus at Village Elementary School, effective school year 2020-21. Action taken by the Governing Board included direction for the Superintendent to provide monthly updates and timelines on efforts made to adequately prepare the facilities, staff, students, and community for the transition.
On January 8, 2020, Village Elementary School Principal Dr. Bergener hosted two tours of the VES facilities for prospective Fall 2020 TK/Kindergarten enrollees. This opportunity served as an orientation of the campus, resources, and logistical flow of ‘a day in the life’ of a TK/K student. In addition, parents were able to ask staff questions, share concerns, and provide feedback. Questions that were not asked/answered during the tour were collected by our PTO President and shared with administration. Responses are currently being collated and a Frequently Asked Questions (FAQ) document will be posted/shared on the Village Elementary website. Included on the FAQ will be opportunities for parents to submit questions and suggestions to administration.
In an effort to solicit feedback regarding the new elementary bell schedule and the pending relocation of TK/K to Village, staff participated in the ThoughtExchange prompt ‘What are important things for us to consider as we provide positive opportunities for students and staff within our bell schedule?’ prior to Winter Break. The highest ranked responses/reflections from staff included the need to stagger release time for TK/K in 2020-21 to ease current congestion during departure, building ‘snack times’ into the schedule for TK/K, and presenting the staff and community with the draft bell schedule in early Spring. All of these suggested changes will be implemented and communicated out to our community prior to Fall 2020.
We will begin working with the Coronado Police Department this Spring on a new traffic study and potential increase in crossing guard support for school year 2020-21.
VES iLAB
The iLAB (Innovation Lab) at Village Elementary is up and running for all students! After opening this month, all students at Village main campus now have access to new designated space where STEAM learning will come to life. Innovation Lab is a STEAM-integrated special(s) course. Students learn, build, and create in small cooperative learning groups in order to solve real-world problems through the engineering and design process. I-lab utilizes the Project Lead the Way “Launch” curriculum, which focuses on Engineering and Computer Science. I-lab is part of CUSD’s K-12 STEAM pathway supported by CSF. One of the highlights of I-lab is the integration of the VEX-IQ lab kits which allow students to build simple and complex machines, including robotics and aircraft. We are excited to offer these experiences to our Kindergarten students starting Fall 2020.